


One of my favorite investing quotes comes from Peter Lynch, the famous Fidelity Magellan mutual fund manager of the 1980s. He said the key to making money in stocks is not to get scared of them.
That is, of course, easier said than done. No one believes they’ll sell their stocks after they go down. But in the heat of the moment, when concern and panic are the prevailing sentiment, it often feels better to cut and run than to stay invested and potentially lose even more. Everyone worries about how much worse it will get. Bear markets extinguish optimism.
In my experience, there are two reasons why investors get scared in market declines and often bail out. The first is that they aren’t prepared for bear markets. The second is because they expect things to only get worse and believe a recovery is a long way off. But if we look at history, we can establish a more realistic expectation of temporary portfolio losses and how long it might take to recover.
One of the benefits of our asset class approach to investing is that the funds we use have been around for several decades. We can review many challenging market environments to see how bad things have gotten. Let’s look more closely at the worst periods for our diversified stock portfolios.
For the all-stock allocation, I’ll use a common mix for clients: 21% DFA US High Profitability Fund (DFA US Large Company Fund prior to 6/2017 inception), 21% DFA US Large Value Fund, 28% DFA US Small Value Fund, 18% DFA Int’l Value Fund, and 12% DFA Int’l Small Value Fund, rebalanced quarterly.
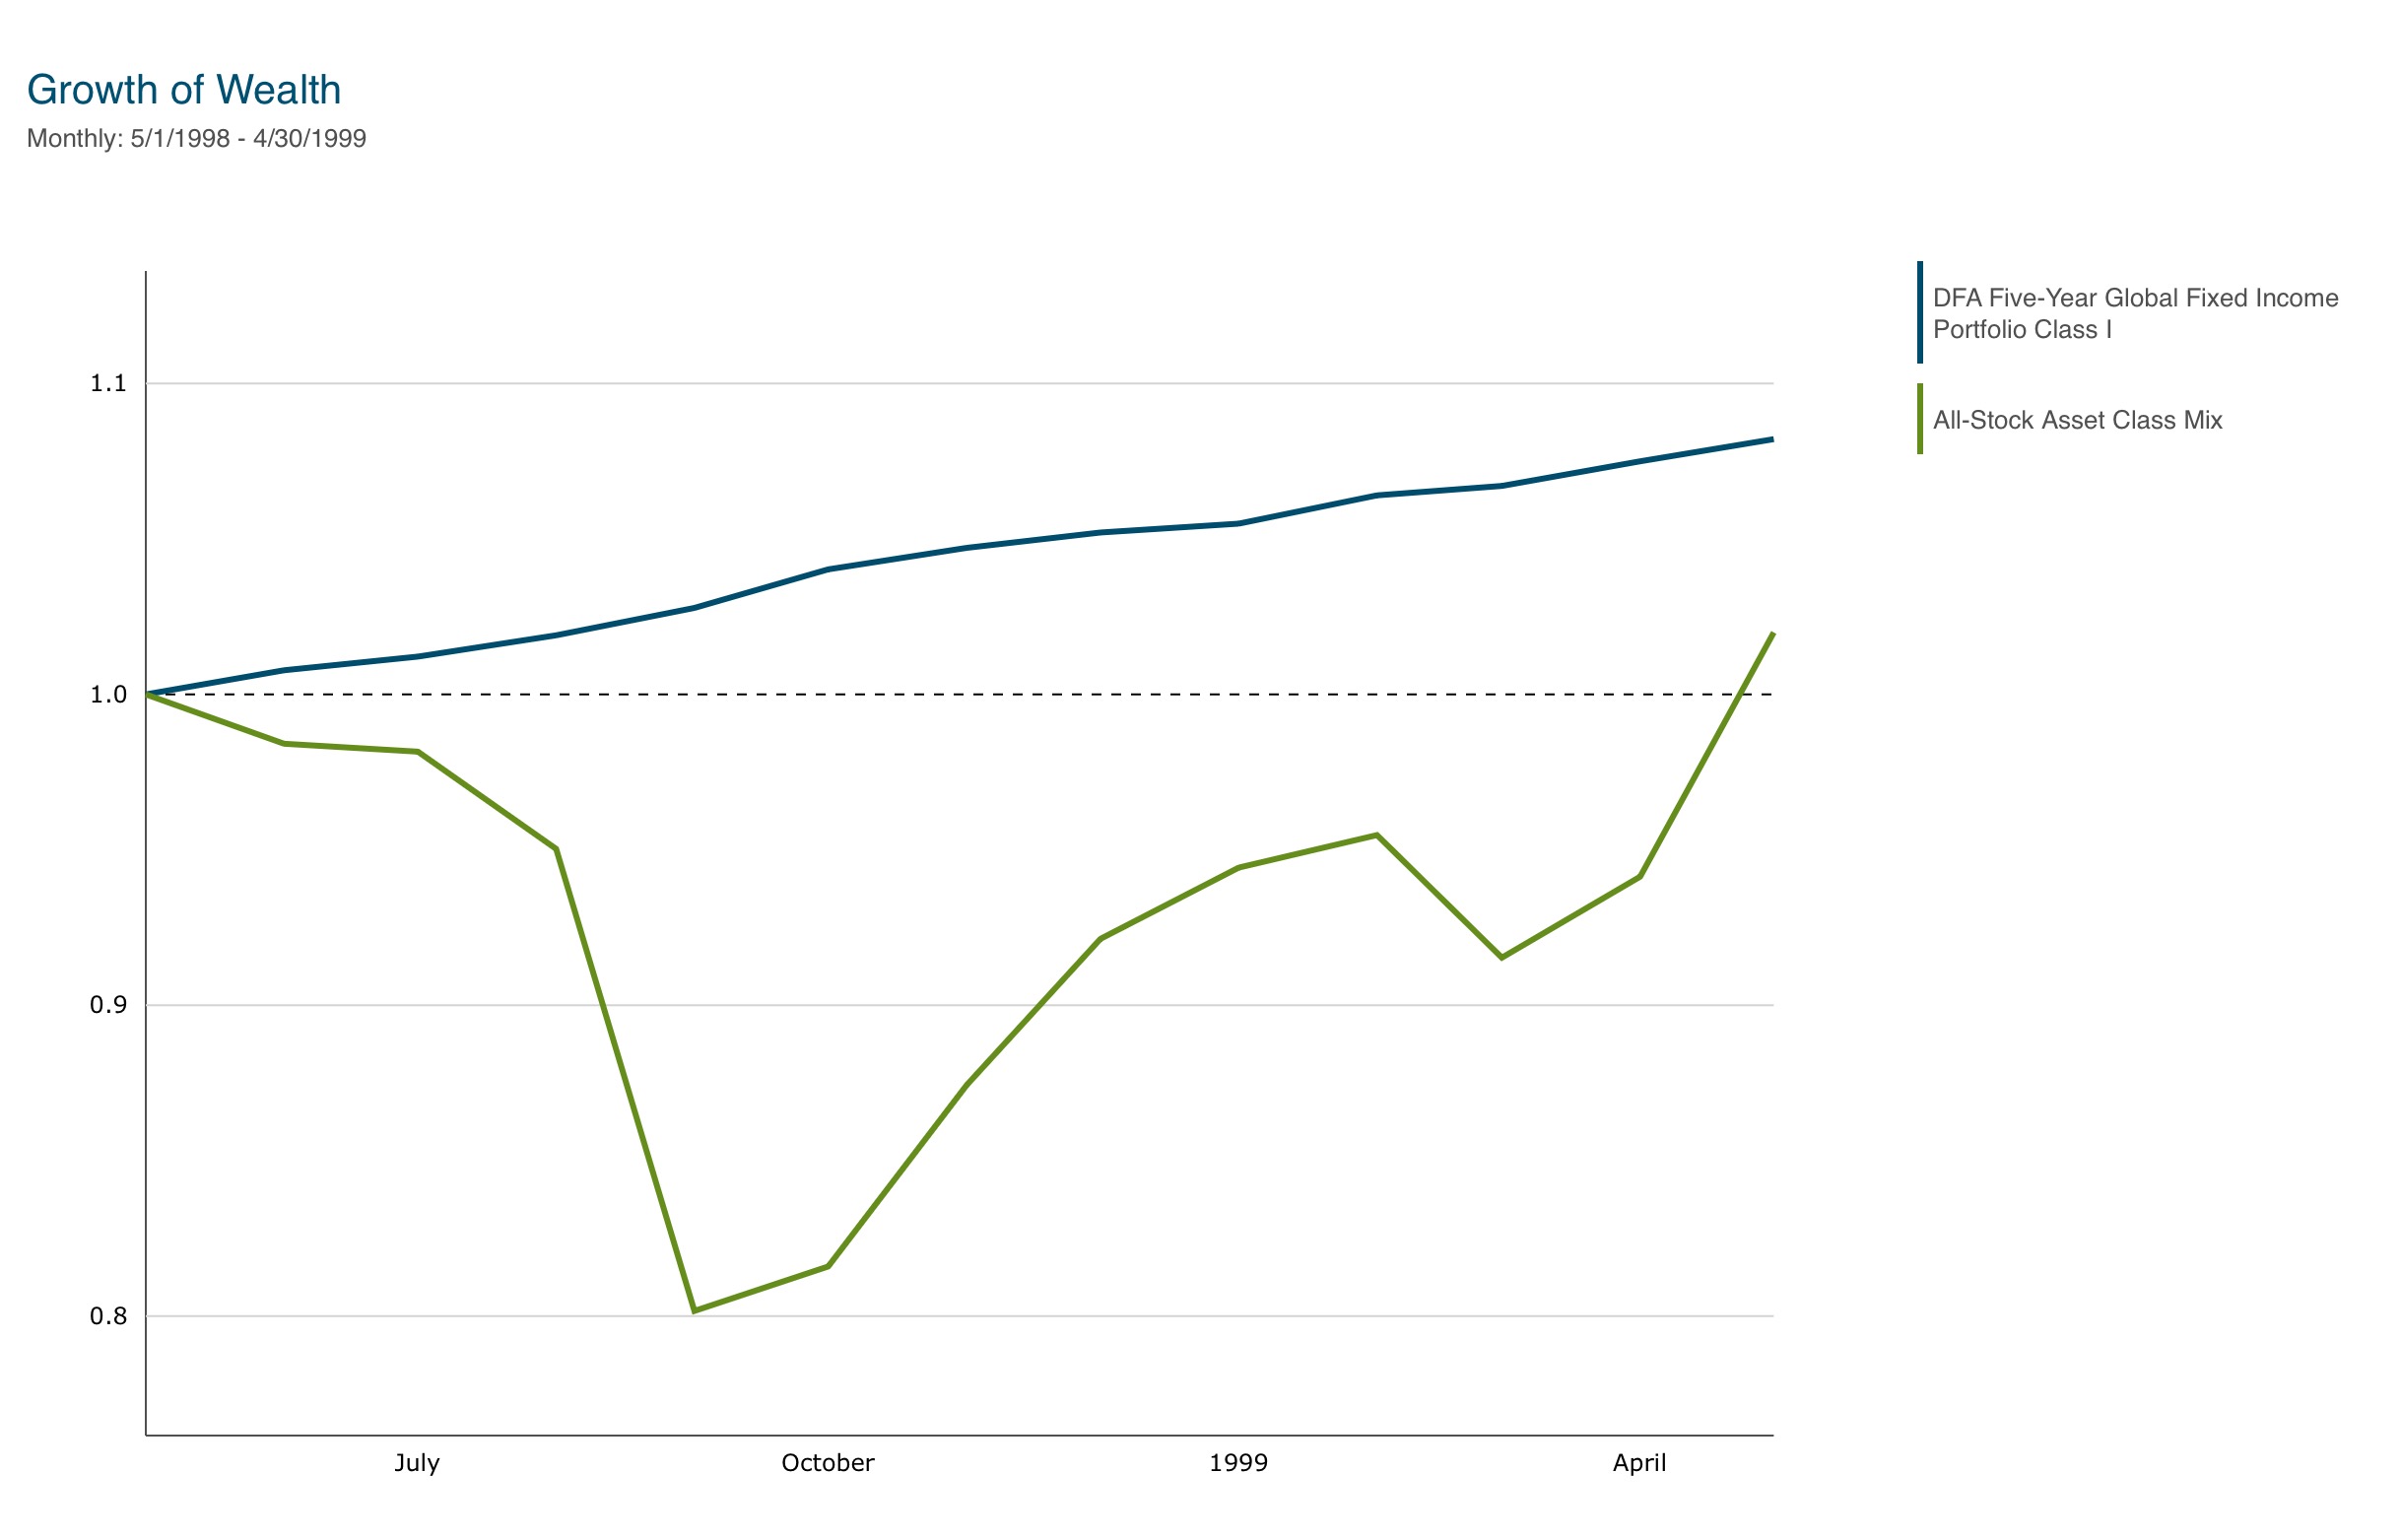
The first decline I’ll highlight happened so long ago that almost no one remembers. It was as close to a bear market (a decline of -20% or more)as it gets without crossing the -20% threshold. From May through August 1998, the All-Stock Mix declined -19.7%. The Russian government defaulted on its debt, causing a cascading effect on the global economy, and famously took down the hedge fund Long-Term Capital Management, requiring a $3.6 billion bailout. Despite this rocky four-month stretch, the stock portfolio fully recovered eight months later, by April 1999.
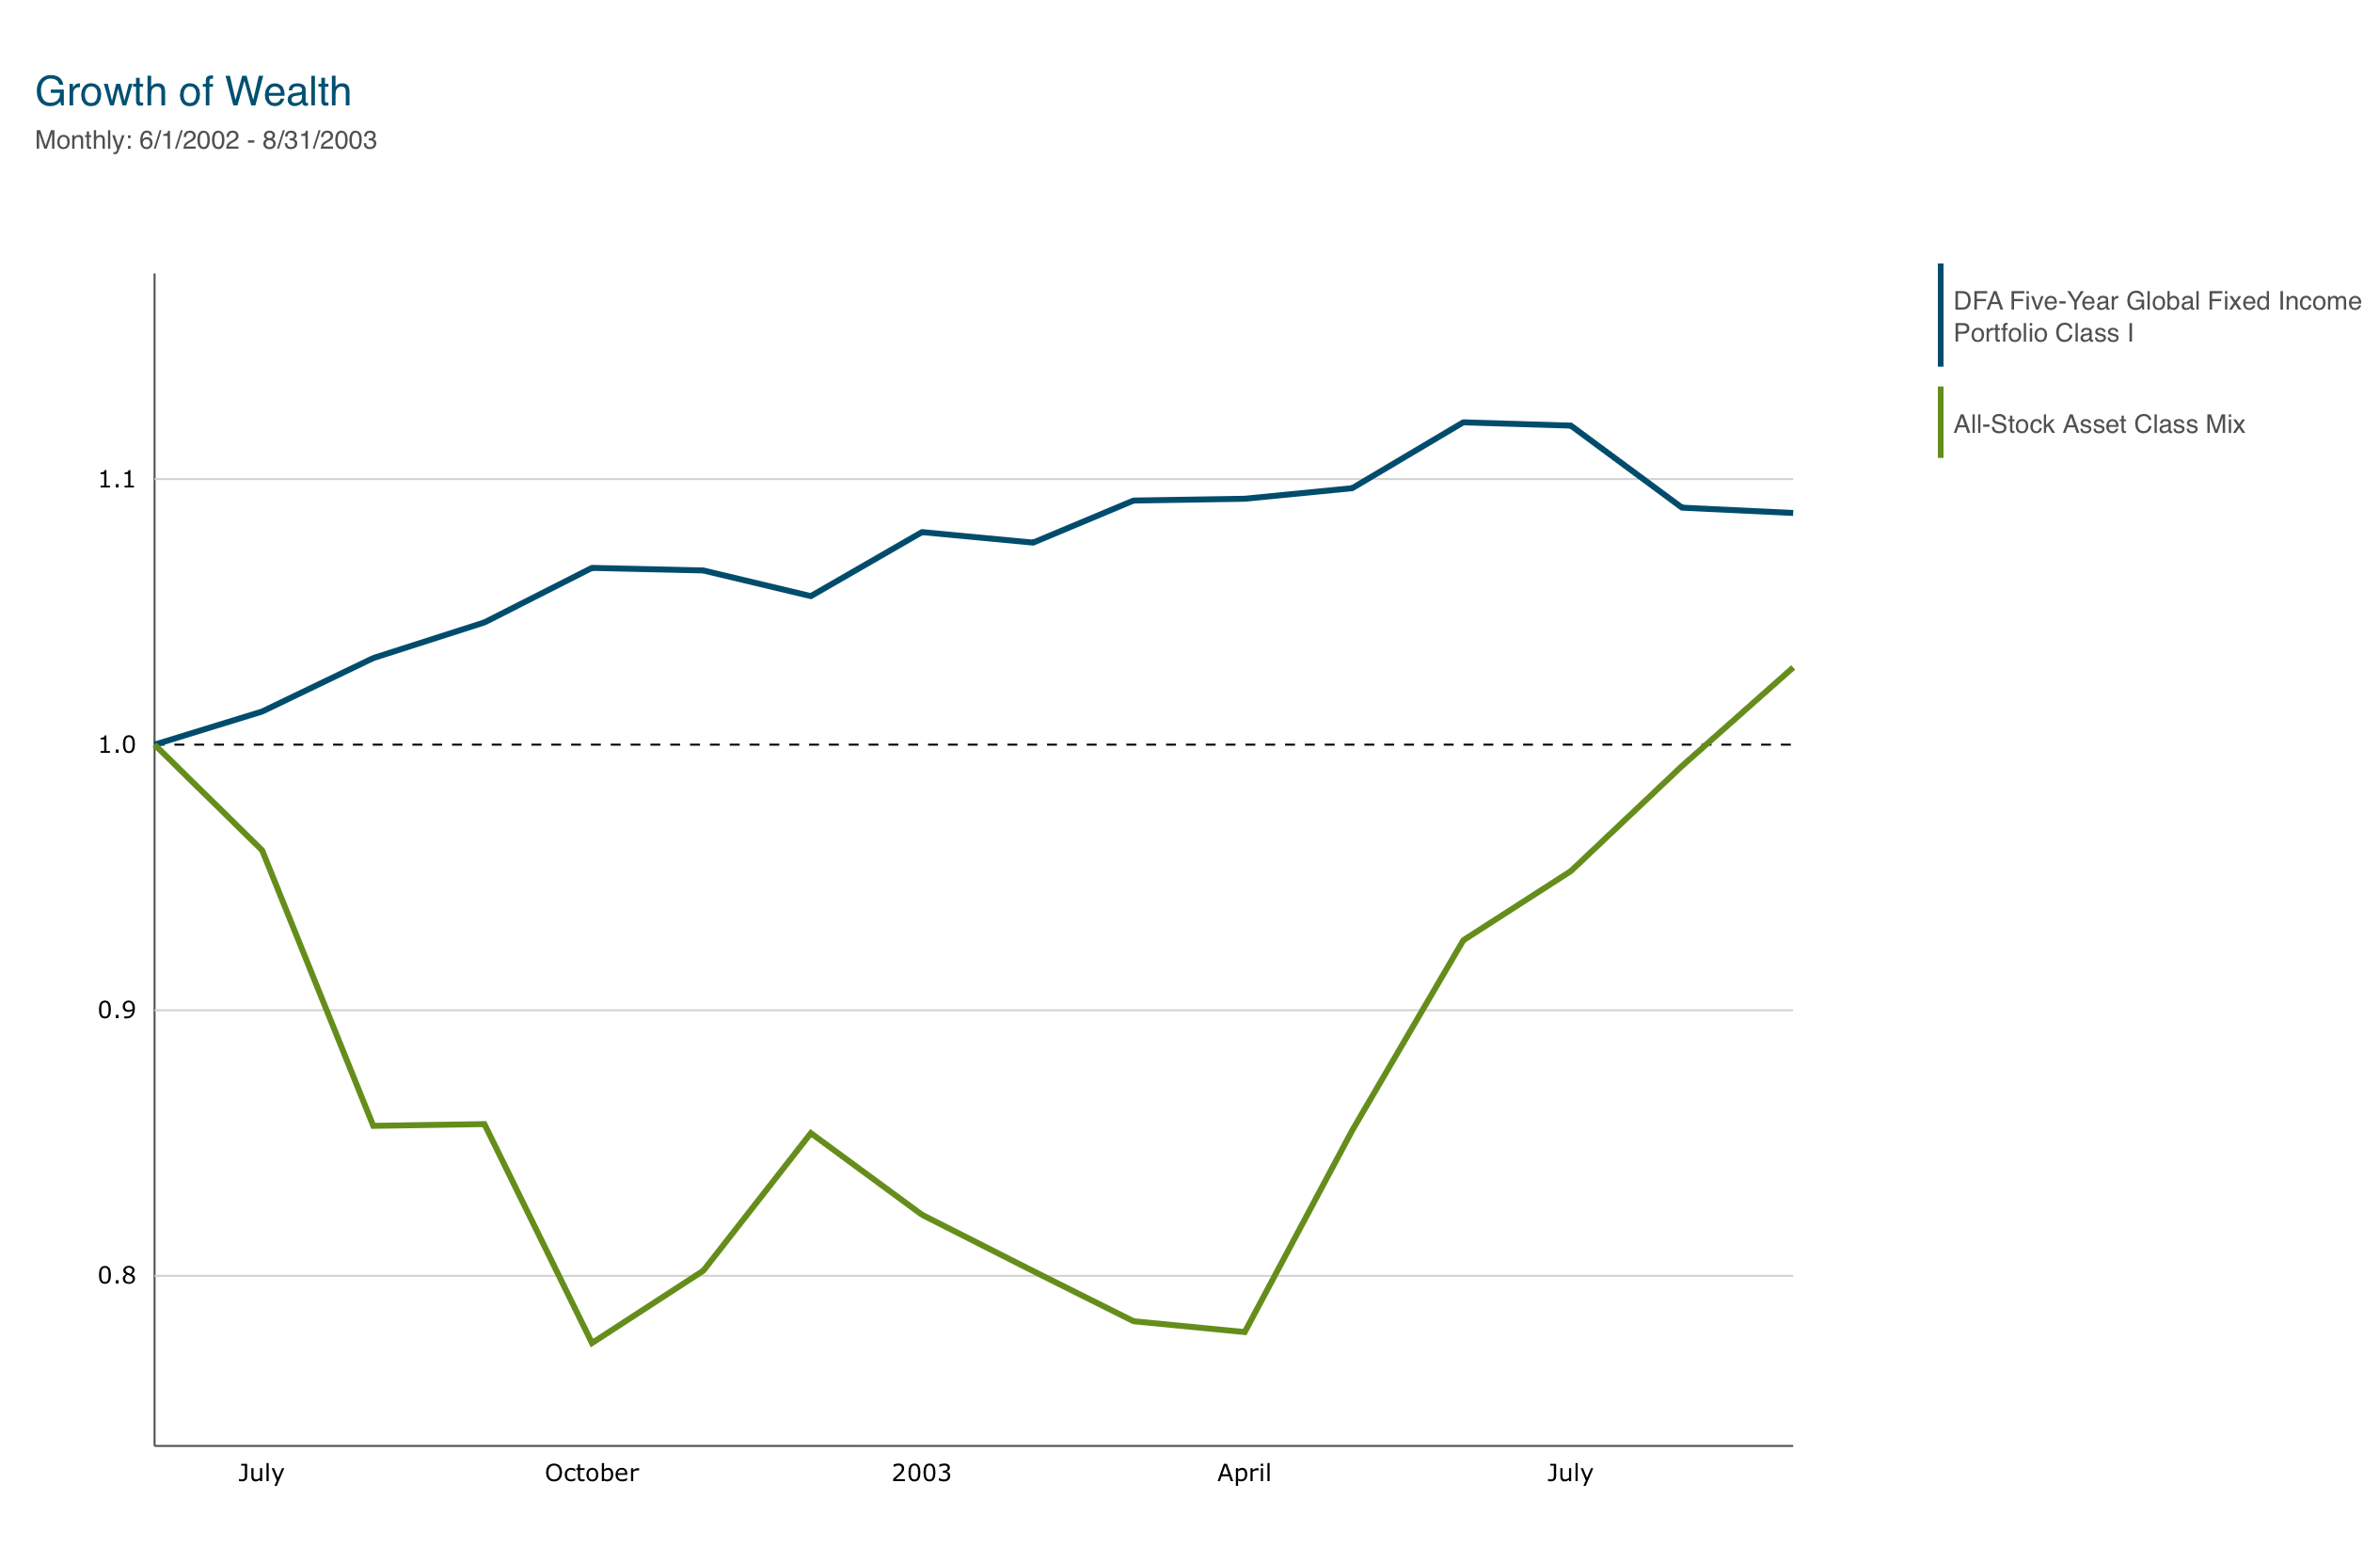
The next decline was the first official bear market on the list and was also a four-month drop. From June through September 2002, the All-Stock Mix declined -22.5%. The US market started to fall in 2000 after several years of well-above-average returns for the S&P 500 and tech stocks in the 1990s. But instead of a market-wide decline, we saw a rotation into smaller and more value-oriented stocks in 2000 and 2001 after they underperformed in the 1990s. But by mid-2002, the weight of the 9/11 terrorist attacks and a weak global economy proved too much, and all stocks eventually headed lower. Despite the steep decline, the stock portfolio fully recovered in less than a year, reaching all-time highs by August 2003.
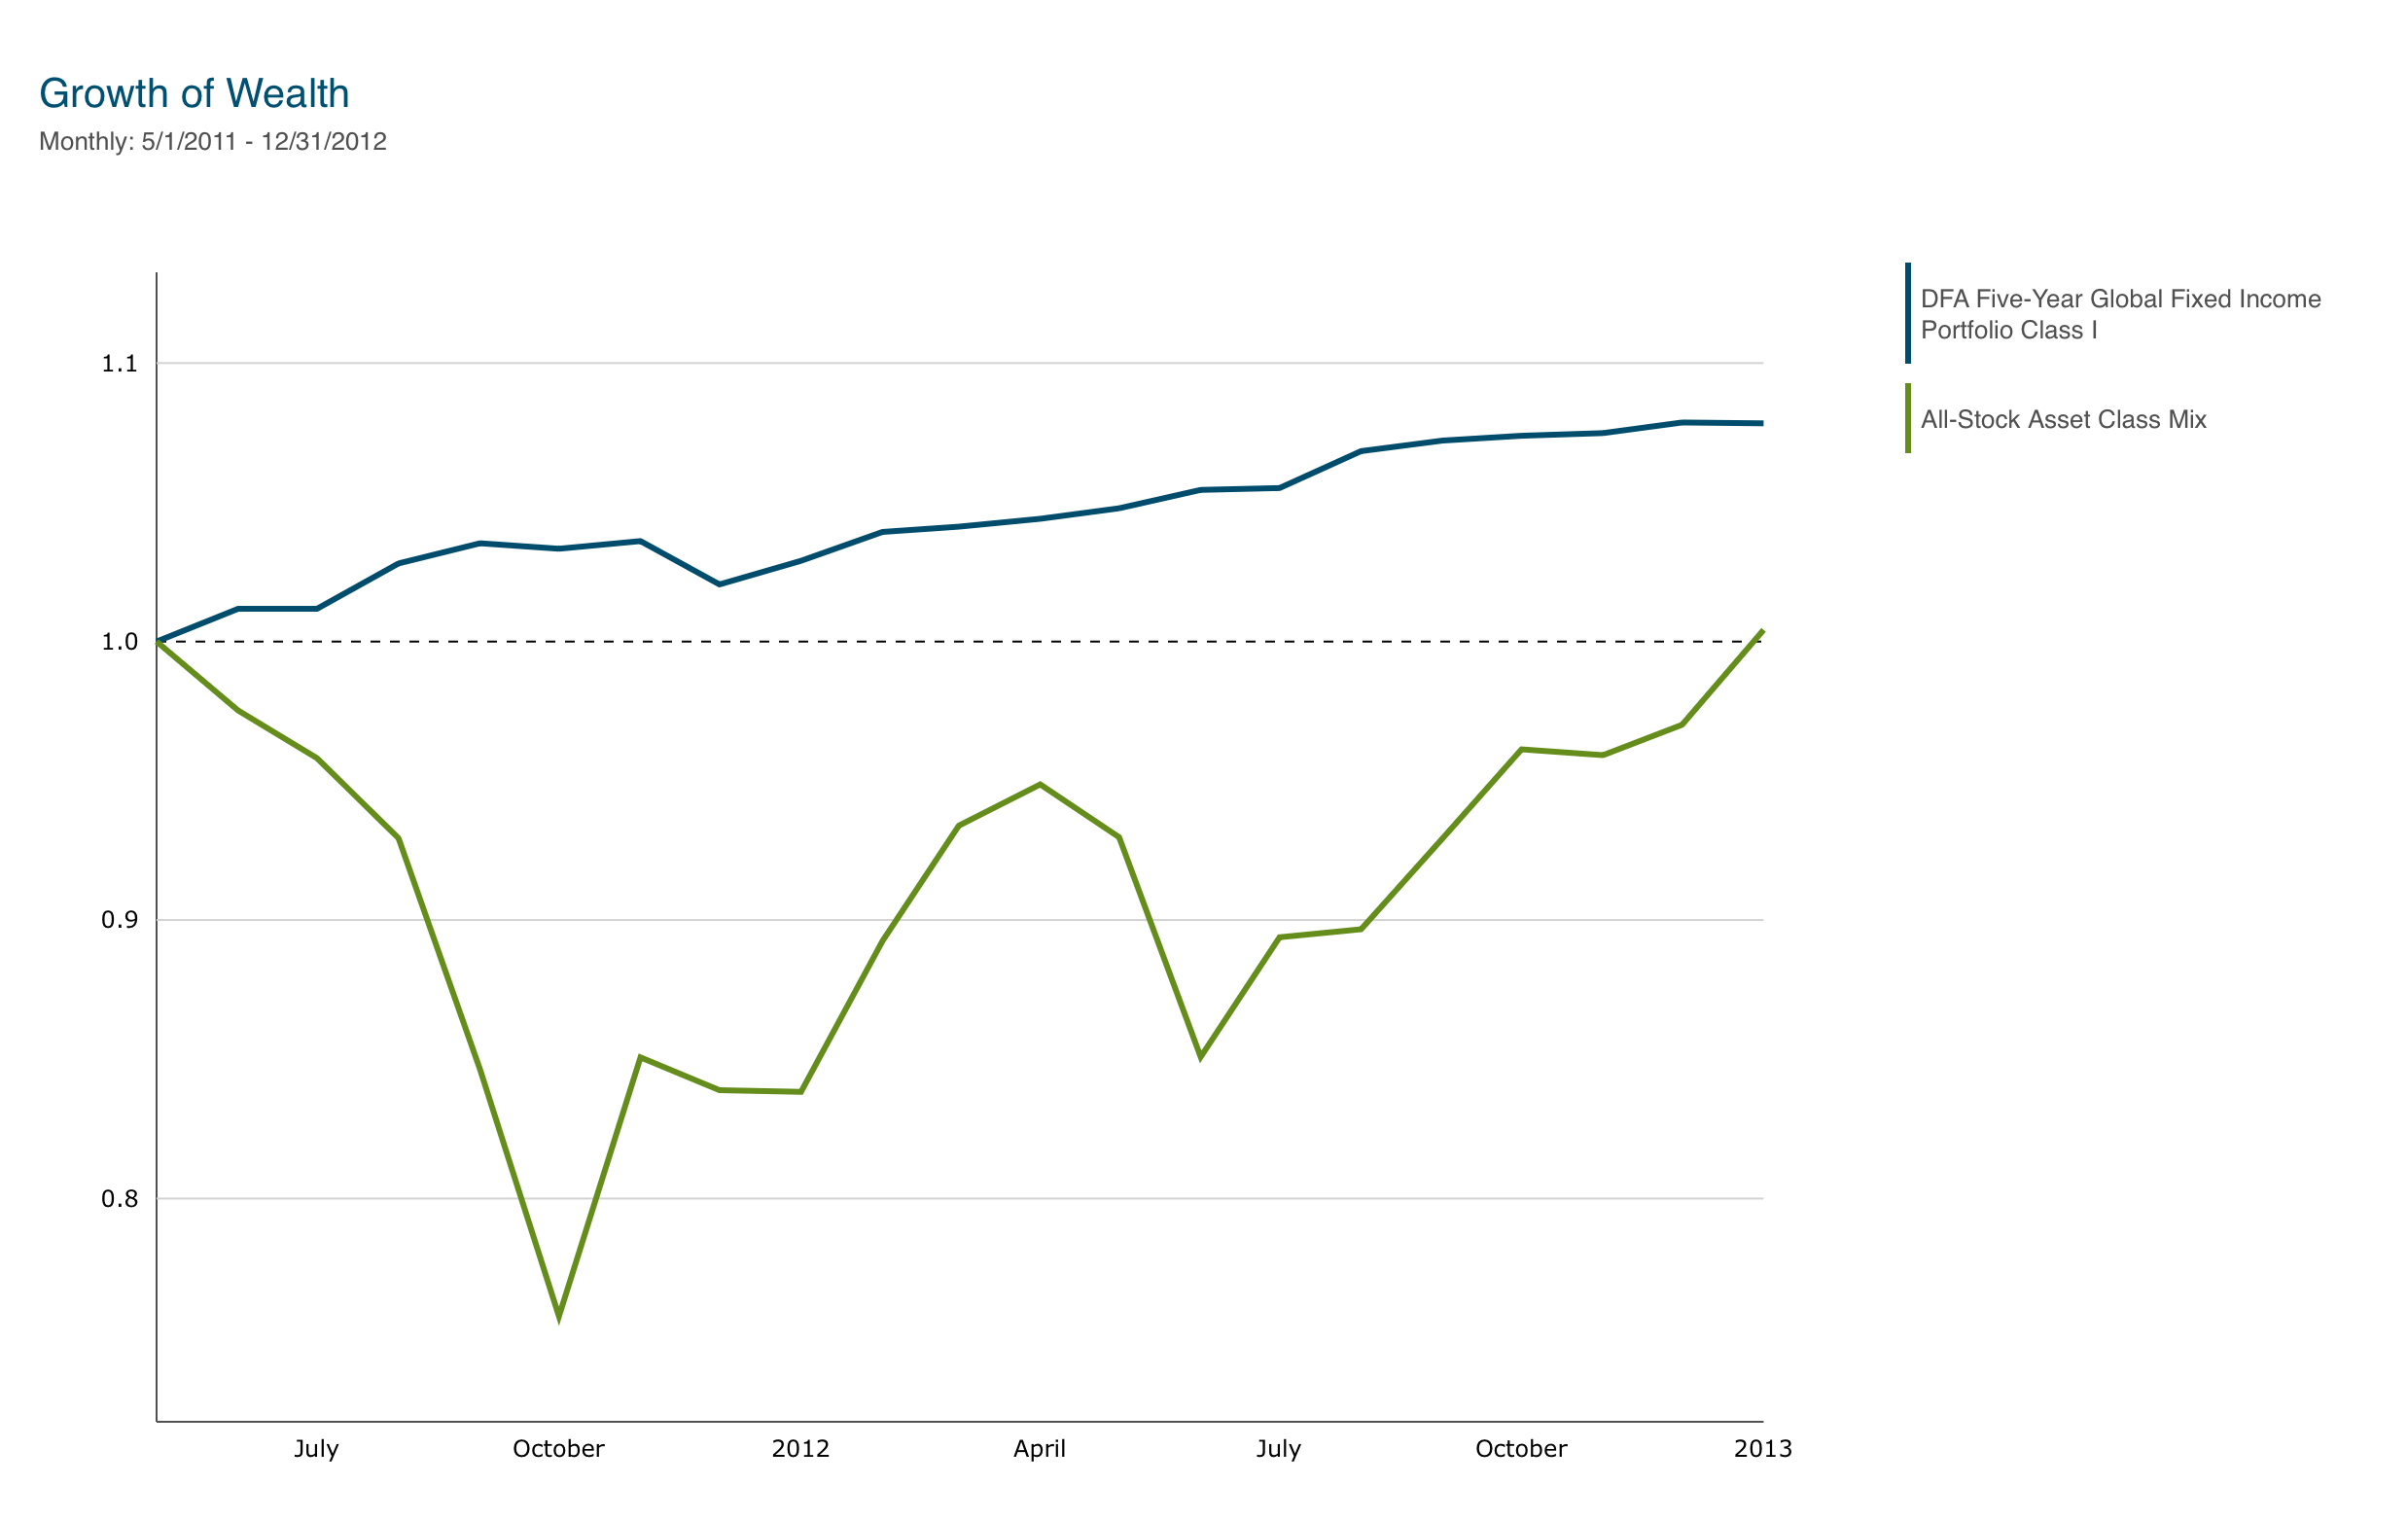
You may remember the bear market in 2011, which lasted from May through September. It was noteworthy because we had just bounced back from the worst stock decline since The Great Depression in 2008 (detailed below), and very few investors had any tolerance for more losses. At the time, many people thought the bear market would be bad enough to retest the lows of early 2009. The cause of this decline was a debt ceiling debate in Congress that led to the first-ever ratings cut of US debt by Standard & Poor’s rating agency to below triple-A. The decline peaked at -24.7%. However, stocks rebounded in the fourth quarter of 2011, and after just a year and three months, the All-Stock Mix reached new highs in December 2012.
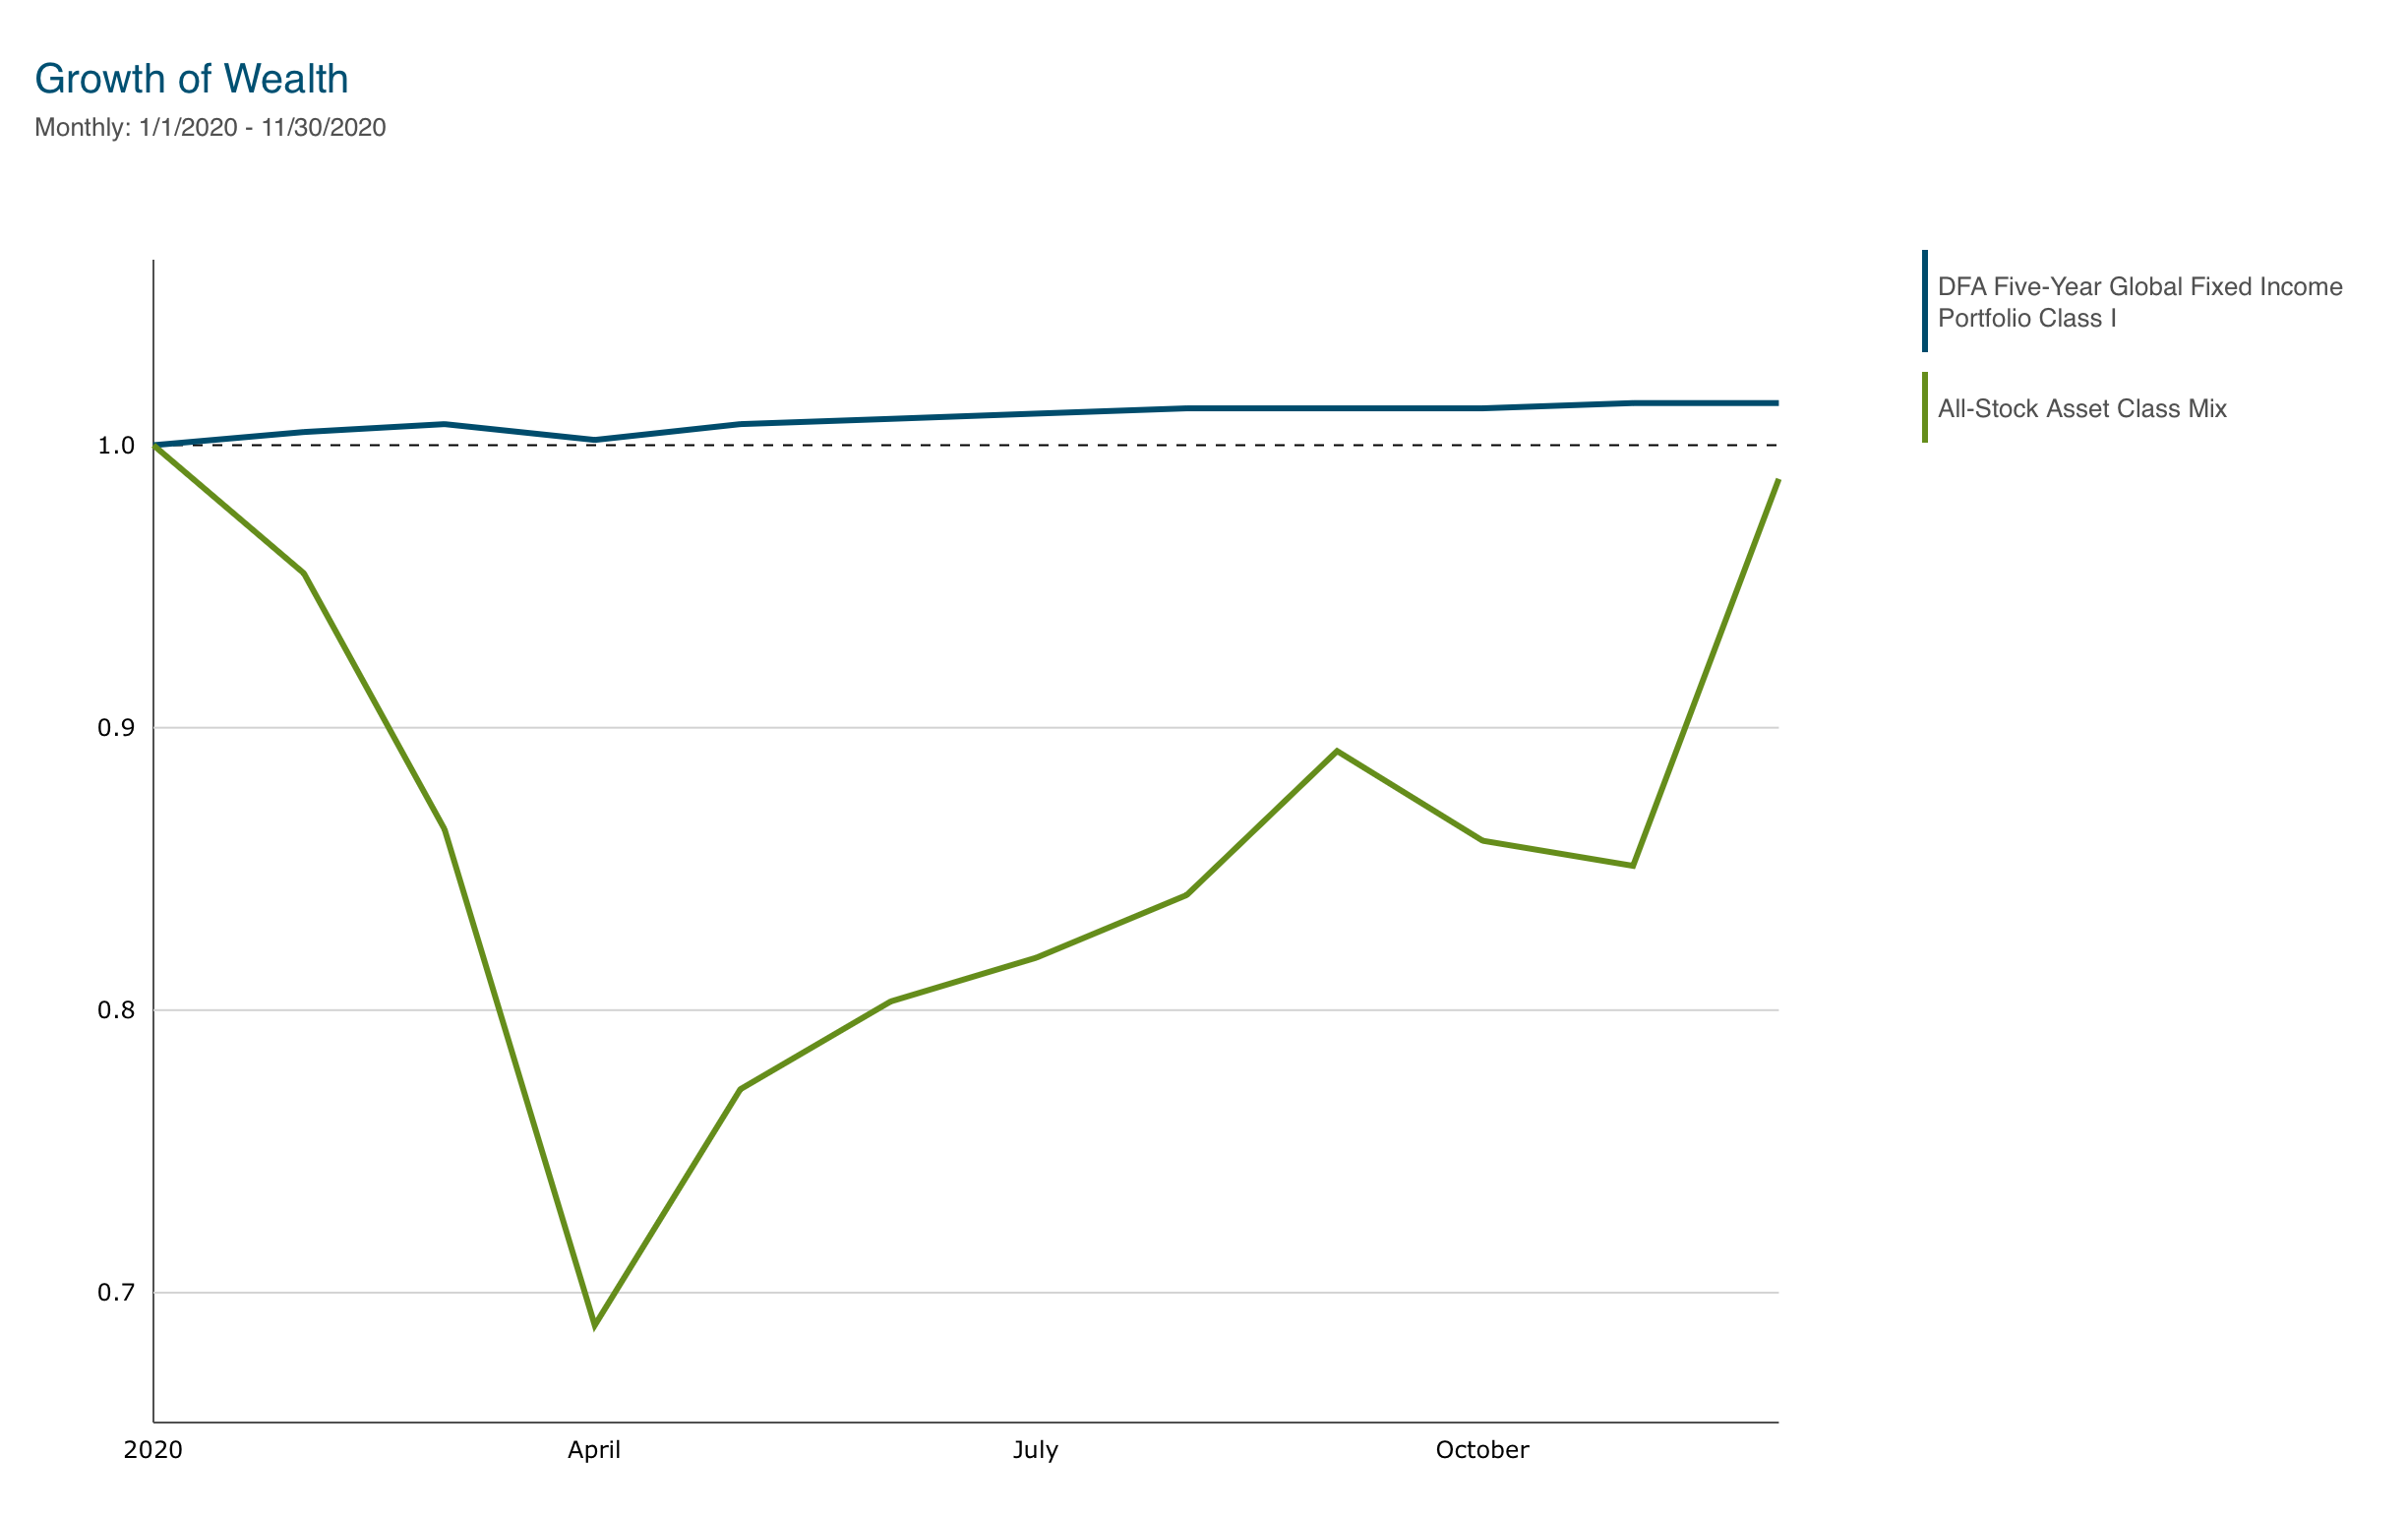
The second-to-last decline I’ll reference is one you’re almost certain to remember, triggered by the Covid-induced, economy-wide lockdowns in 2020. After a strong 2019, the All-Stock Mix fell a whopping -31% between January and March 2020, including a decline of over -20% in March alone! That was scary. But as fast as stocks fell, they seemed to recover almost as quickly. By November of 2020, just eight months after the decline ended, the All-Stock Mix had reached a new all-time high.
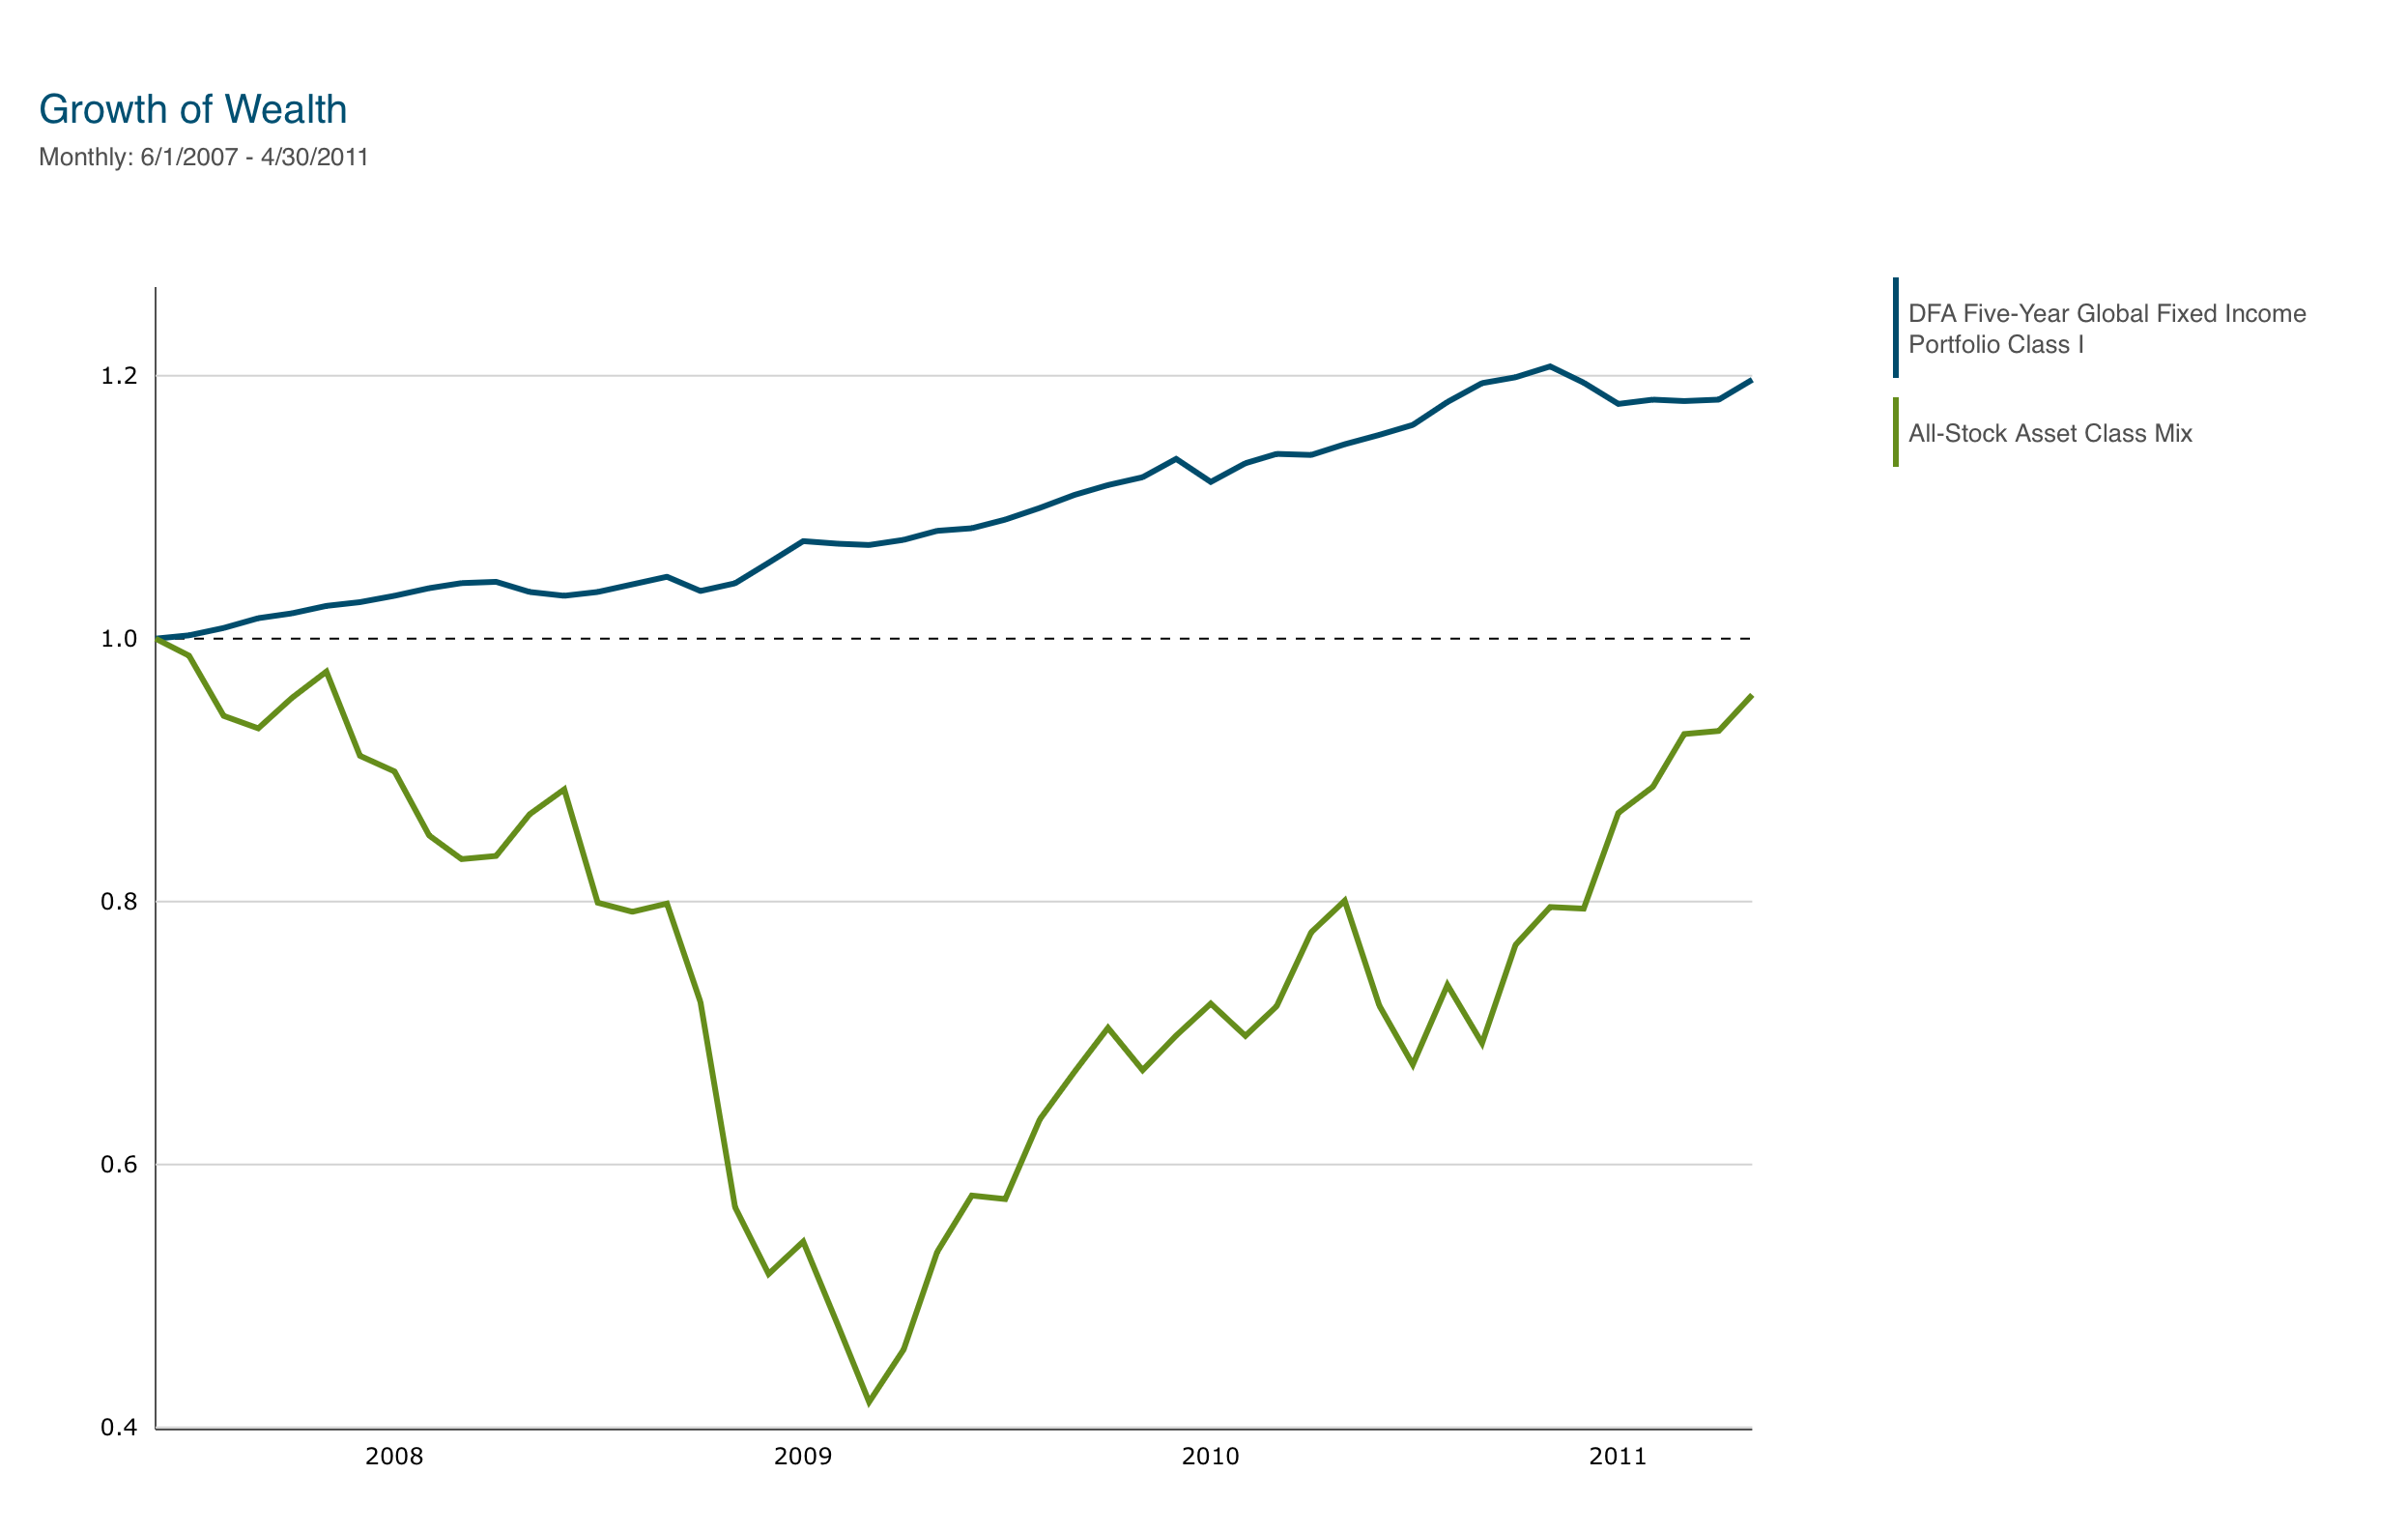
I’ve saved the worst for last—in terms of the severity of the decline. The Great Financial Crisis, as we’ve come to call it, saw the All-Stock Asset Class Mix begin to fall in June 2007. Losses intensified in the Fall of 2008 and continued until February 2009. This was by far the most prolonged decline in modern history and much longer than any of the above examples, lasting only a few months. By early 2009, the stock mix had dropped -58.1%, a staggering decline. In order to find a time when the market had fallen by this much, we have to look back to The Great Depression from 1929-1932. But despite how steep the drop was, the recovery still didn’t take long. By April 2011, just over two years later, the diversified stock portfolio had regained almost all of its losses.
Now that we know all about the market declines over the last three decades, what lessons can we take from them?
Let’s start with frequency. Every year, pundits tell us that another bear market is coming. But that’s not what the evidence shows. There were five different bear markets in the last 30 years (far more than during the prior 30 years), which means one bear market every six years, or about two a decade. That’s it. They’re not even close to an annual event.
How about magnitude? Yes, 2008 was brutal, and even a diversified stock portfolio lost almost -60%. There is no way to sugarcoat this period. It’s the Titanic of modern bear markets. But it was the exception and not the norm. Expecting a -50%+ decline regularly just isn’t practical. The typical bear market sees a loss of between -20% and -30%, a much more reasonable decline.
Now, let’s discuss recoveries. People always get the math wrong on recovery returns. They say, “At 10% per year (the average stock return over all periods), it’s going to take two to three years or more to come back; I don’t have that long.” But as you can see from the summaries above, it barely took two years to recover from the 2007-2009 decline, and usually, it only took months or quarters instead of years. Why? Because recovery returns aren’t average returns. They are well above average. Said differently, stock prices go down—often too far—and then they correct by coming back just as fast.
In the year after the 1998 decline, the stock portfolio gained +30.4%, in the year after the 2002 decline, it gained +33.6%, +26.9% in the year after the 2011 bear market, +74% in the year following March 2020, and +71.8% for the first 12 months after the 2007-2009 collapse. What do you notice about these numbers? Rebound returns rise monotonically as we go from the milder to the more severe bear markets. I always remind clients that they don’t want to bail out in a steep decline because they run the risk of missing an even more rapid recovery—when it comes to bear markets, the worse they are, the better the recovery tends to be.
Having read this historical account, you might now feel better prepared for what can happen to your stock portfolio in bad times. You might be more confident that you can weather the temporary storm and survive until the recovery. If you’re still saving money, you might even look at these temporary declines for what they are—the ultimate buying opportunity!
But a common question is: What if you’re no longer working? Can you afford to endure these declines and not run out of money? Yes. There’s no need to bail out to avoid these losses if you fully participate in the recoveries. Over the entire period, the diversified stock portfolio averaged about +10% per year despite these declines. That’s more than enough return to fund ongoing spending of 4-5% per year of your portfolio value plus inflation.
You may also choose not to stay 100% invested in stocks in retirement; instead, hold some percentage of your portfolio in a short-term bond fund that tends to go up during these stock market declines. For example, setting aside three years of spending (15% of your portfolio), or five years of spending (25% of your portfolio), in the DFA Five-Year Global Fund hasn’t ruined your retirement, and for many clients gives them the peace of mind that they don’t have to spend any of their stocks during a future bear market. Seven years of spending (35% of your portfolio) could be reasonable for a few clients who want even more liquidity.
As I always caution clients, holding bonds and stocks means you’ll get lower returns and have less money in the long run. But if this decision keeps you from getting scared out of your stock portfolio when things go bad, then it’s worth it. That’s the key to making money in stocks. Remember—the goal of investing isn’t to get the highest possible return but to earn a return higher than your savings and spending needs call for.
_______________________________________
Past performance is not a guarantee of future results. Index and mutual fund performance includes reinvestment of dividends and other earnings but does not reflect the deduction of investment advisory fees or additional expenses except where noted. Indexes and mutual funds shown are for illustrative purposes only and may not be the only or any of the funds that Servo clients hold. Servo was not managing client portfolios over the entirety of the periods shown. This content is informational and should not be considered an offer, solicitation, recommendation, or endorsement of any particular security, product, or service.