


Traditional stock indexes have reached record levels of concentration. The Nasdaq has over 33% of its holdings in five technology companies; the S&P 500 Index has over 40% in just 10 companies. We normally consider "indexes" synonymous with diversification; today, they're anything but.
For now, at least, concentration has paid off. The Nasdaq Index has returned 21% annually over the decade ending in April. The S&P 500 Index, which is only slightly less technology-centric than the Nasdaq, is up over 15%. These are not typical market or large-growth stock returns; these companies have averaged about 10% annually over the last century. We did see similar outsized gains in the 1990s, however; +24% and +21% for the Nasdaq and S&P 500 Index, respectively, for the decade ending in 1999.
Been There, Done That
Stock returns well above the long-term trend do occur from time to time, when investor expectations for these companies' future success reach a fever pitch. Individuals and professionals alike are willing to pay any price to get in on the next set of transformative companies. It happened in the 1960s with the "Nifty Fifty" stocks, and it happened in the 1990s with the internet. Artificial intelligence is the third episode in this comedy that has always turned into tragedy. The (cyclically adjusted) price-to-earnings "valuation" for the S&P 500 Index—a familiar measure of how "expensive" stocks are—reached 42 this month, a level only seen for a few months in late 1999 and early 2000 before prices crashed. The average level over the last 100 years? 17. Almost 3x lower. Today, optimism abounds.
I'm wary of these periods—referred to as stock bubbles by many market commentators—because the internet boom and collapse from 1998-2002 was the defining experience of my first decade as a financial advisor. I swore never to forget its lessons.
The devastation that investors felt after piling into dot-com stocks and mutual funds in the 1990s, only to see the S&P 500 lose 44% of its value, and the Nasdaq Index decline 75% from April 2000 through September 2002, is immeasurable. 10 years after the market peak in March 2000, the Nasdaq was still down 45%; performance-chasing tech investors had only $0.55 of every dollar invested in the late 1990s, and even S&P 500 investors had lost money. These losses ruined countless investors' financial dreams.
Sadly, many investors have forgotten these lessons. But not me. The way we invest is, in part, designed to make sure we don't repeat the mistakes everyone made a quarter century ago.
Valuable Insights
Stock market bubbles tend to form around the highest-priced companies that claim the most promising new technologies. The natural antidote to this boom/bust pattern is to buy lower-priced stocks. Large and small value stock asset classes don't chase high-flying stocks; just the opposite, they buy the cheapest 30% of companies based on prices relative to earnings or assets (book value). When the stocks go up, they're sold, and new low-priced stocks are purchased with the proceeds. Buy low, sell high at its purest.
Instead of following the herd, value goes against the grain, and it works. Value stocks have higher long-term expected returns than growth stocks—the Fama/French US Large Value and Small Value Indexes have returned 12.3% and 14.2% per year since 1926, compared to 10.2% and 8.7% for the Fama/French US Large and Small Growth Indexes, respectively.
In contrast to the -75% decline on the Nasdaq and the -44% drop in the S&P 500, the Fama/French US Large Value Index lost only -19% from 2000 to 2002. The Fama/French US Small Value Index actually gained +19%. International value asset classes performed similarly—the Fama/French International Value Index dropped only 26%, the Dimensional International Small Value Index gained 4%.
 Value investing helps insulate us from speculative bubbles, in part, by holding stocks across relatively cheaper sectors. Technology stocks are dramatically underweighted in value strategies; financials, energy, and health care companies naturally receive more weight. But bubble-wary investors don't have to avoid technology stocks completely or rely solely on value strategies. A well-balanced portfolio—the default for all long-term investors—should include both growth and value stocks, despite sensible concerns about bubbles.
Profits Before Prices
Long-term investors like us need to find a system for buying relatively higher-priced growth stocks when the high prices are justified. How best to do that? Ensure our higher-priced stock holdings also have higher company profitability.
A high-profitability index or strategy is, in effect, a growth-stock portfolio. Companies ranked by relative profits rather than prices typically trade at higher prices. But importantly, a profitability strategy only holds higher-priced stocks as long as their profits are robust. Stocks are dropped from a high-profitability strategy when the company's profits decline; the proceeds are used to buy new companies with stable but rising profits.
A high-profitability strategy offers the least insulation from stock bubbles, because it is, after all, invested in growth stocks. But it can provide some cushion compared to traditional indexes. The Fama/French US High Profitability Index declined 34% from April 2000 to September 2002, 10% less than the S&P 500 and only half as much as the Nasdaq.
Including a US high-profitability allocation allows investors to stay balanced between growth and value stocks without having to predict the exact timing of an asset-style leadership change. And in the long run, high profitability, like low-priced value, has higher expected returns. From 1964 to March 2026, the Fama/French US High Profitability Index returned +12.1% vs +10.6% for the S&P 500, often producing its best relative returns when value is doing its worst.
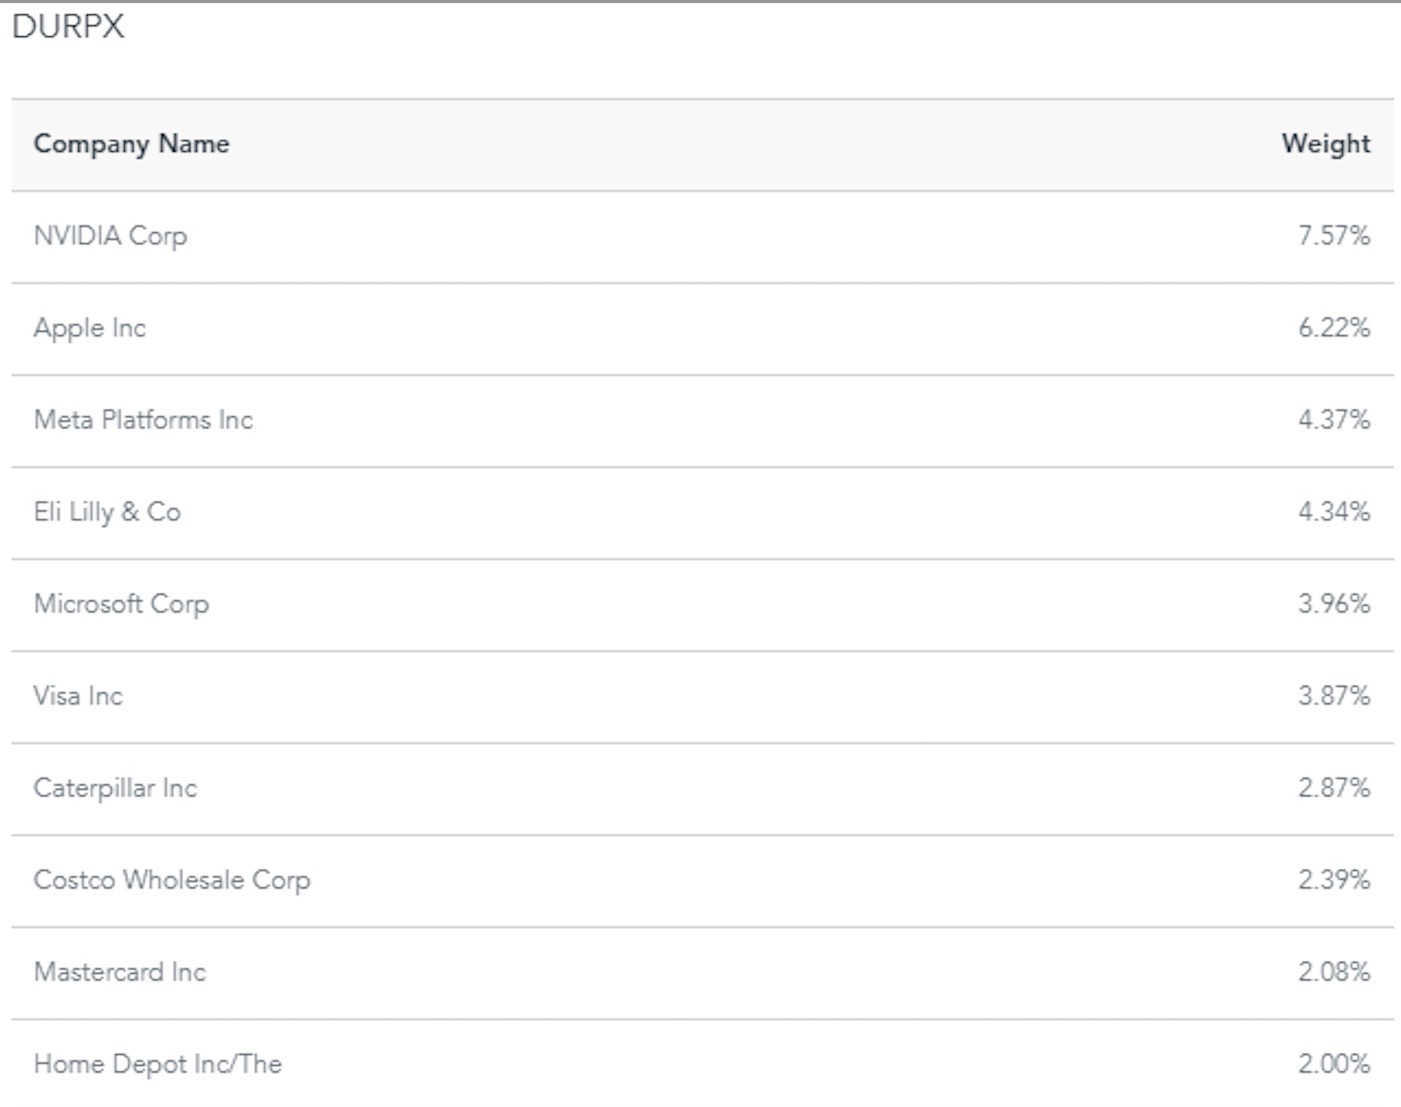
Interestingly, a high profitability strategy today looks less growth-oriented than at any time in recent history. A review of the Dimensional US High Profitability Portfolio's top 10 holdings reveals several familiar Magnificent 7 companies—Apple, Microsoft, and Nvidia. But the list is missing less profitable companies: Tesla, Broadcom, and Amazon. In their place are more reasonably priced and more profitable "blue chip" companies: Eli Lilly, Visa, Caterpillar, Costco, and The Home Depot, to name a few. High profitability might withstand a bursting growth-stock bubble better than historical data suggests.
Planning Ahead
Is it time to worry about a stock market bubble? Unlike so many short-term, transient concerns, stock bubbles pose a significant challenge for investors. But bubbles shouldn't worry us. I've studied past periods of excessive market optimism (and pessimism) as much as anyone. And while investment history doesn't repeat, it tends to rhyme. I've constructed your portfolio to be as insulated as possible from the bursting of another stock market bubble, while still offering the opportunity for good returns in speculative times that are inevitable but impossible to forecast.
Not only is your portfolio well-suited for your long-term goals, but it's also an ideal allocation for the biggest investment uncertainty we face today.
_________________________________________
Source of data: Dimensional Fund Advisors; Dimensional Returns Program.
Past performance is not a guarantee of future results. Index and mutual fund performance include reinvestment of dividends and other earnings but do not reflect the deduction of investment advisory fees or other expenses, except where noted. Indexes and mutual funds shown are for illustrative purposes only and may not be the only or any of the funds that Servo clients hold. Servo did not manage client portfolios for the entire period shown. This content is informational and should not be considered an offer, solicitation, recommendation, or endorsement of any particular security, product, or service.